[ad_1]
Justin Sullivan
Broadcom (NASDAQ:AVGO) reported FY Q3 results after the market close on Thursday, Sept. 1, beating earnings expectations for the ninth consecutive quarter. The company also beat expectations on revenue, which was up 24.8% year-on-year. Management raised its estimate for revenue in Q4. The results and commentary from management were sufficiently good that CEO Hock Tan prefaced the analyst call by saying “we feel somewhat surreal here with what I’m about to report.” AVGO rose 1.67% on Friday, Sept. 2, as compared to -1.1% for the iShares Semiconductor ETF (SOXX).
Seeking Alpha
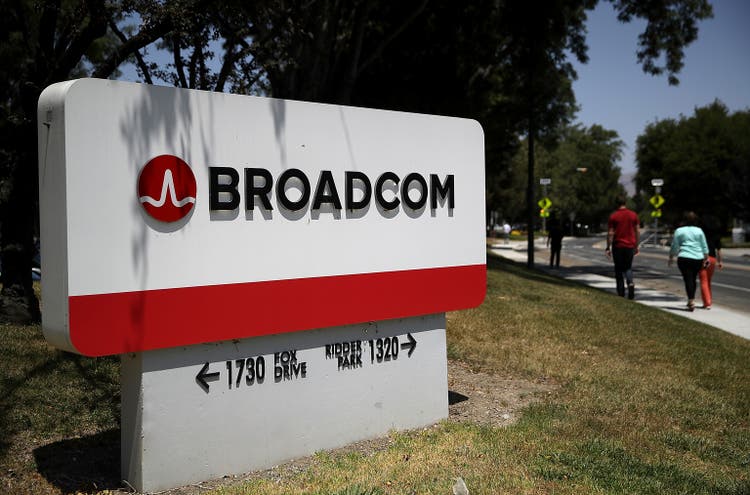
12-Month price history and basic statistics for AVGO (Source: Seeking Alpha)
I wrote about AVGO on Aug. 15, two weeks prior to earnings. At that time, I raised my rating from a hold to a buy. In rating a stock, I rely heavily on two forms of consensus outlooks. The first is the Wall Street analyst consensus, which is provided in the form of a rating and a 12-month price target. The second is a probabilistic outlook that is implied by the prices of call and put options on a stock, the market-implied outlook.
For readers who are unfamiliar with the market-implied outlook, a brief explanation is needed. The price of an option on a stock is largely determined by the market’s consensus estimate of the probability that the stock price will rise above (call option) or fall below (put option) a specific level (the option strike price) between now and when the option expires. By analyzing the prices of call and put options at a range of strike prices, all with the same expiration date, it’s possible to calculate a probabilistic price forecast that reconciles the options prices. This is the market-implied outlook. For a deeper explanation and background, I recommend this monograph published by the CFA Institute.
While the Wall Street analyst consensus price target does tend to have predictive value, there are some obvious limitations. First and foremost, calculating a consensus relies on combining ratings and prices targets issued over an extended period of time. The standard is to use analyst opinions published over the past 3 months / 90 days. Over this period, new information emerges and analyst ratings issued later in the 90 days may be based on a materially different outlook than those earlier in the period. Research suggests that the decline in predictive value of the consensus when there is a large spread in individual price targets may be due to out-of-date analysis from some analysts. The analysts following AVGO have responded very quickly to the FY Q3 results. Of the 12 ranked analysts included in ETrade’s version of the consensus outlook, 9 have updated their ratings and price targets on Sept. 1 or 2.
The market-implied outlook reflects the real-time pricing on expected future outcomes and is thus less susceptible to the risk of having out-of-date information.
Given the strength of the FY Q3 results and the raised management guidance, I am revisiting my analysis to look at the extent to which both the Wall Street consensus outlook and the market-implied outlook have shifted from before the earnings to report to just after.
Wall Street Consensus Outlook for AVGO
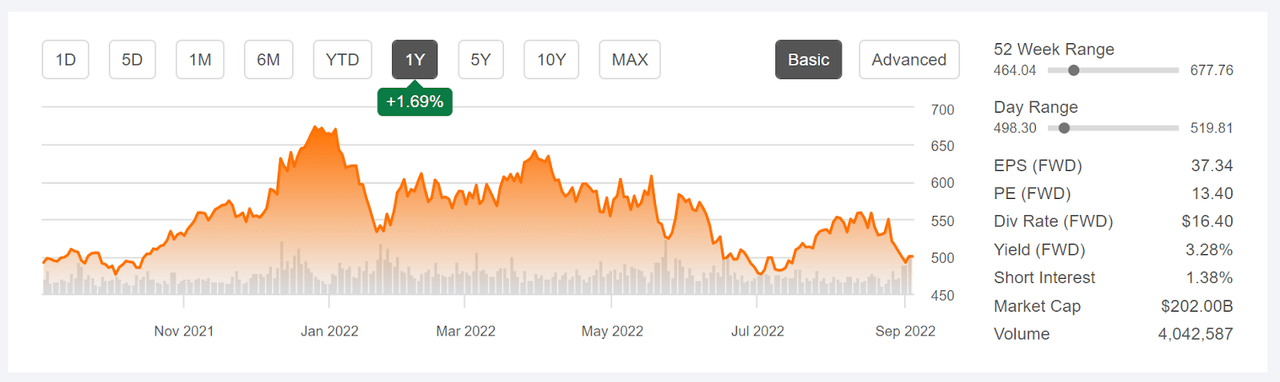
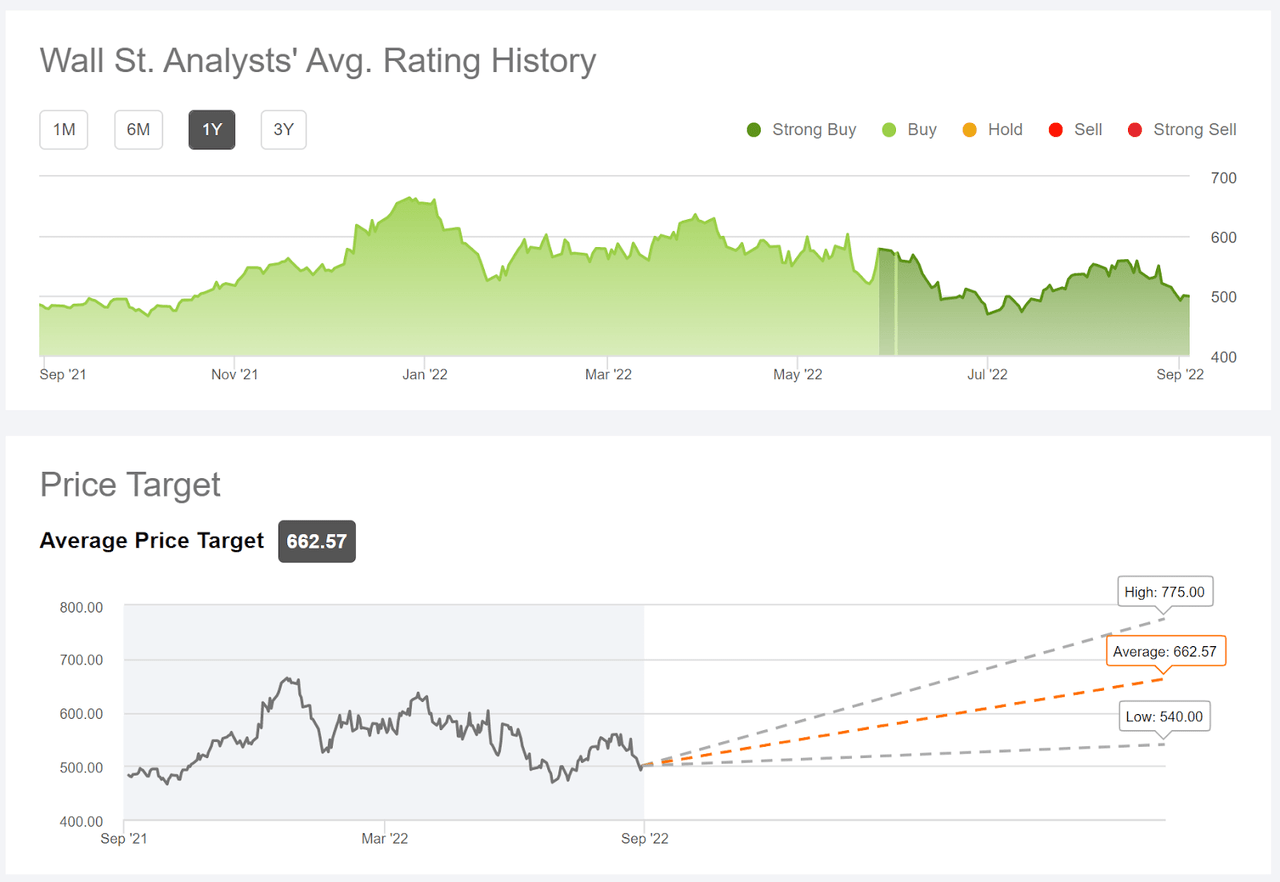
ETrade calculates the market-implied outlook for AVGO by combining the views of 12 ranked analysts who have published price targets and ratings over the past three months. The consensus rating is a buy, as it has been for all of the past year, and the consensus 12-month price target is $676.36, which is 35.2% above the current share price. On Aug. 15, the consensus 12-month price target was $698.64, which was 25.1% above the share price at that time. Even though the consensus price target is lower, the expected 12-month return is higher because of the decline in the share price since Aug. 15.
ETrade
Wall Street analyst consensus rating and 12-month price target for AVGO (Source: ETrade)
Seeking Alpha’s version of the Wall Street consensus outlook for AVGO is calculated using ratings and price targets from 26 analysts who have published their views over the past 90 days. The consensus rating is a strong buy and the consensus 12-month price target is 32.5% above the current share price. Consistent with ETrade’s results, the consensus 12-month price target has fallen slightly since August 15th, but the expected 12-month return has risen because of the now-lower price.
Seeking Alpha
Wall Street analyst consensus rating and 12-month price target for AVGO (Source: Seeking Alpha)
The Wall Street consensus rating and price target has remained stable, even with some analyst revisions since the Q3 earnings announcement. The expected returns over the next year are higher, however, mainly because AVGO shares have fallen with the broader market since mid-August.
Market-Implied Outlook for AVGO
On Aug. 15, I calculated the market-implied outlook using the prices of call and put options that expire on Jan. 20, 2023, a 5.2-month period. In this update, I have calculated the market-implied outlook again using options that expire on this date, but now the remaining period is 4.5 months.
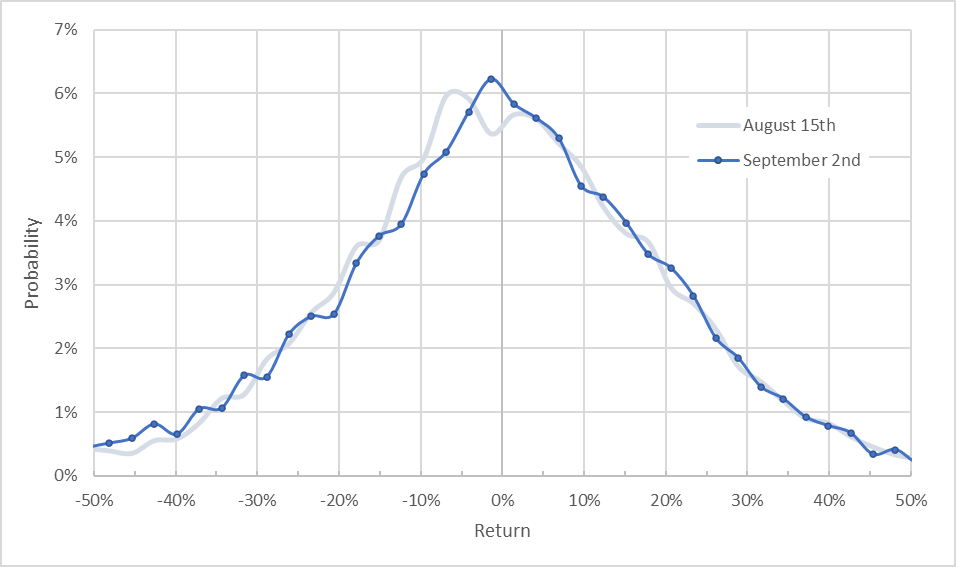
I have plotted the market-implied outlooks using the January 20, 2023 options that were calculated on April 15 and on Sept. 2.
Geoff Considine
Market-implied price return probabilities for AVGO to January 20, 2023. The outlook calculated on August 15th is shown with a gray line and the outlook calculated on September 2nd is shown with the blue line with dots (Source: Author’s calculations using options quotes from ETrade)
The probabilistic price return outlooks from 2 weeks prior to the Q3 earnings report was predominantly neutral, with a bullish tilt. The main feature that made the outlook neutral rather than bullish was that the peak in probability was slightly shifted to favor negative returns. The maximum probability corresponded to a price return of -6% for the next 5.2 months. The expected volatility calculated from this distribution was 32% (annualized).
The updated market-implied outlook to January 20th is very similar to the previous results, although the peak in probability has tilted towards more positive outcomes. The peak probability is at a price return of -1.4% for the next 4.5 months. The expected volatility from this distribution is 35%. The probabilities for positive returns are very similar to the results from August 15th (the gray line is essentially right on top of the blue line on the right ½ of the chart above). The probabilities of negative returns are lower in the updated outlook than in the Aug. 15 outlook, across a range of the most-probable negative outcomes (the gray line is above the solid blue line for returns in the range of -5% to -15%). It is interesting how well the tails of the outlooks match, both on the positive and negative ends of the distribution. The updated market-implied outlook to January 20 2023, calculated on Sept. 2, is more bullish than the outlook calculated on Aug. 15.
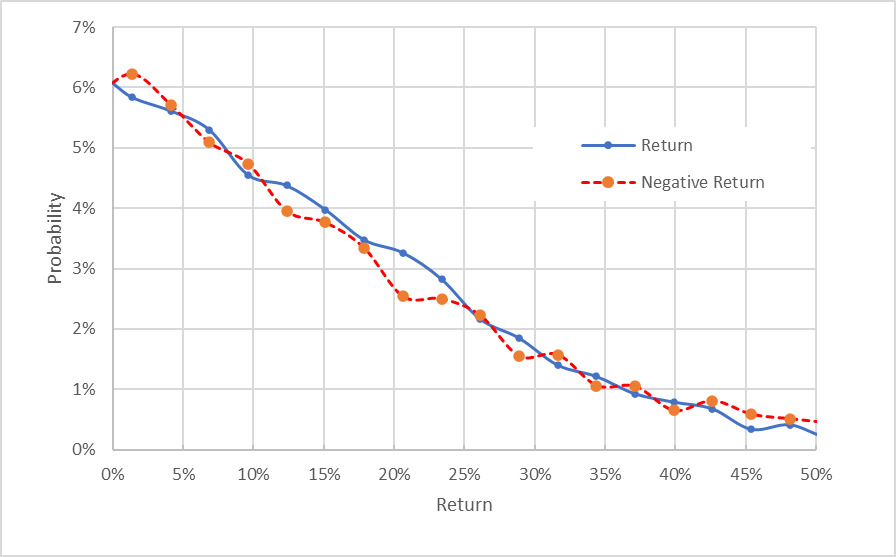
To make it easier to compare the relative probabilities of positive and negative returns, I rotate the negative return side of the distribution about the vertical axis (see chart below).
Geoff Considine
Market-implied price return probabilities for AVGO for the 4.5-month period from September 2nd until January 20, 2023. The negative return side of the distribution has been rotated about the vertical axis (Source: Author’s calculations using options quotes from ETrade)
This view shows that the probabilities of positive and negative returns of the same magnitude match very closely (the solid blue line and the dashed red line are very close to one another), although there is a very slight overall tilt favoring positive returns (the solid blue line is more frequently above the dashed red line than vice versa). This is a slightly bullish outlook.
Theory indicates that the market-implied outlook is expected to have a negative bias because investors, in aggregate, are risk averse and thus tend to pay more than fair value for downside protection. There is no way to measure the magnitude of this bias, or whether it is even present, however. This potential bias reinforces the slightly bullish interpretation of this outlook.
The market-implied outlook to Jan. 20, 2023, has shifted from neutral with a bullish tilt on Aug. 15 to slightly bullish on Sept. 2. The shares are trading 10.2% below where they were on Aug. 15 (vs. a decline of 8.5% for the S&P 500 over this period), so part of the more favorable outlook is probably because the shares are cheaper today.
Summary
In mid-August, the Wall Street consensus outlook for AVGO was bullish and the market-implied outlook was predominantly neutral, with a bullish tilt. Since Aug. 15, when I published my last analysis, AVGO has returned -10.3% vs. -14.8% for the iShares Semiconductor ETF (SOXX) and -8.3% for the S&P 500 (SPY). The company reported strong Q3 guidance on Sept. 1, and management raised its Q4 guidance. The Wall Street consensus rating continues to be bullish, and the expected return over the next year is markedly higher than in mid-August, mainly because the shares have gotten cheaper. The market-implied outlook was neutral with a bullish tilt in mid-August and is now slightly bullish. With the declines in AVGO over the past couple of weeks, combined with the strong results for Q3 and management comments on Q4, today’s outlook for AVGO is even stronger. I’m reiterating my buy rating on the stock.
[ad_2]
Source link